Dashboard
Track Message Performance & Engagement
Overview
The Dashboard provides a comprehensive view of your RCS campaigns and their SMS fallback. It helps you track message requests, delivery status, engagement metrics, and failures in one place.
To Access the RCS Dashboard, log in to your Netcore RCS account. From the left navigation panel, select Dashboard.
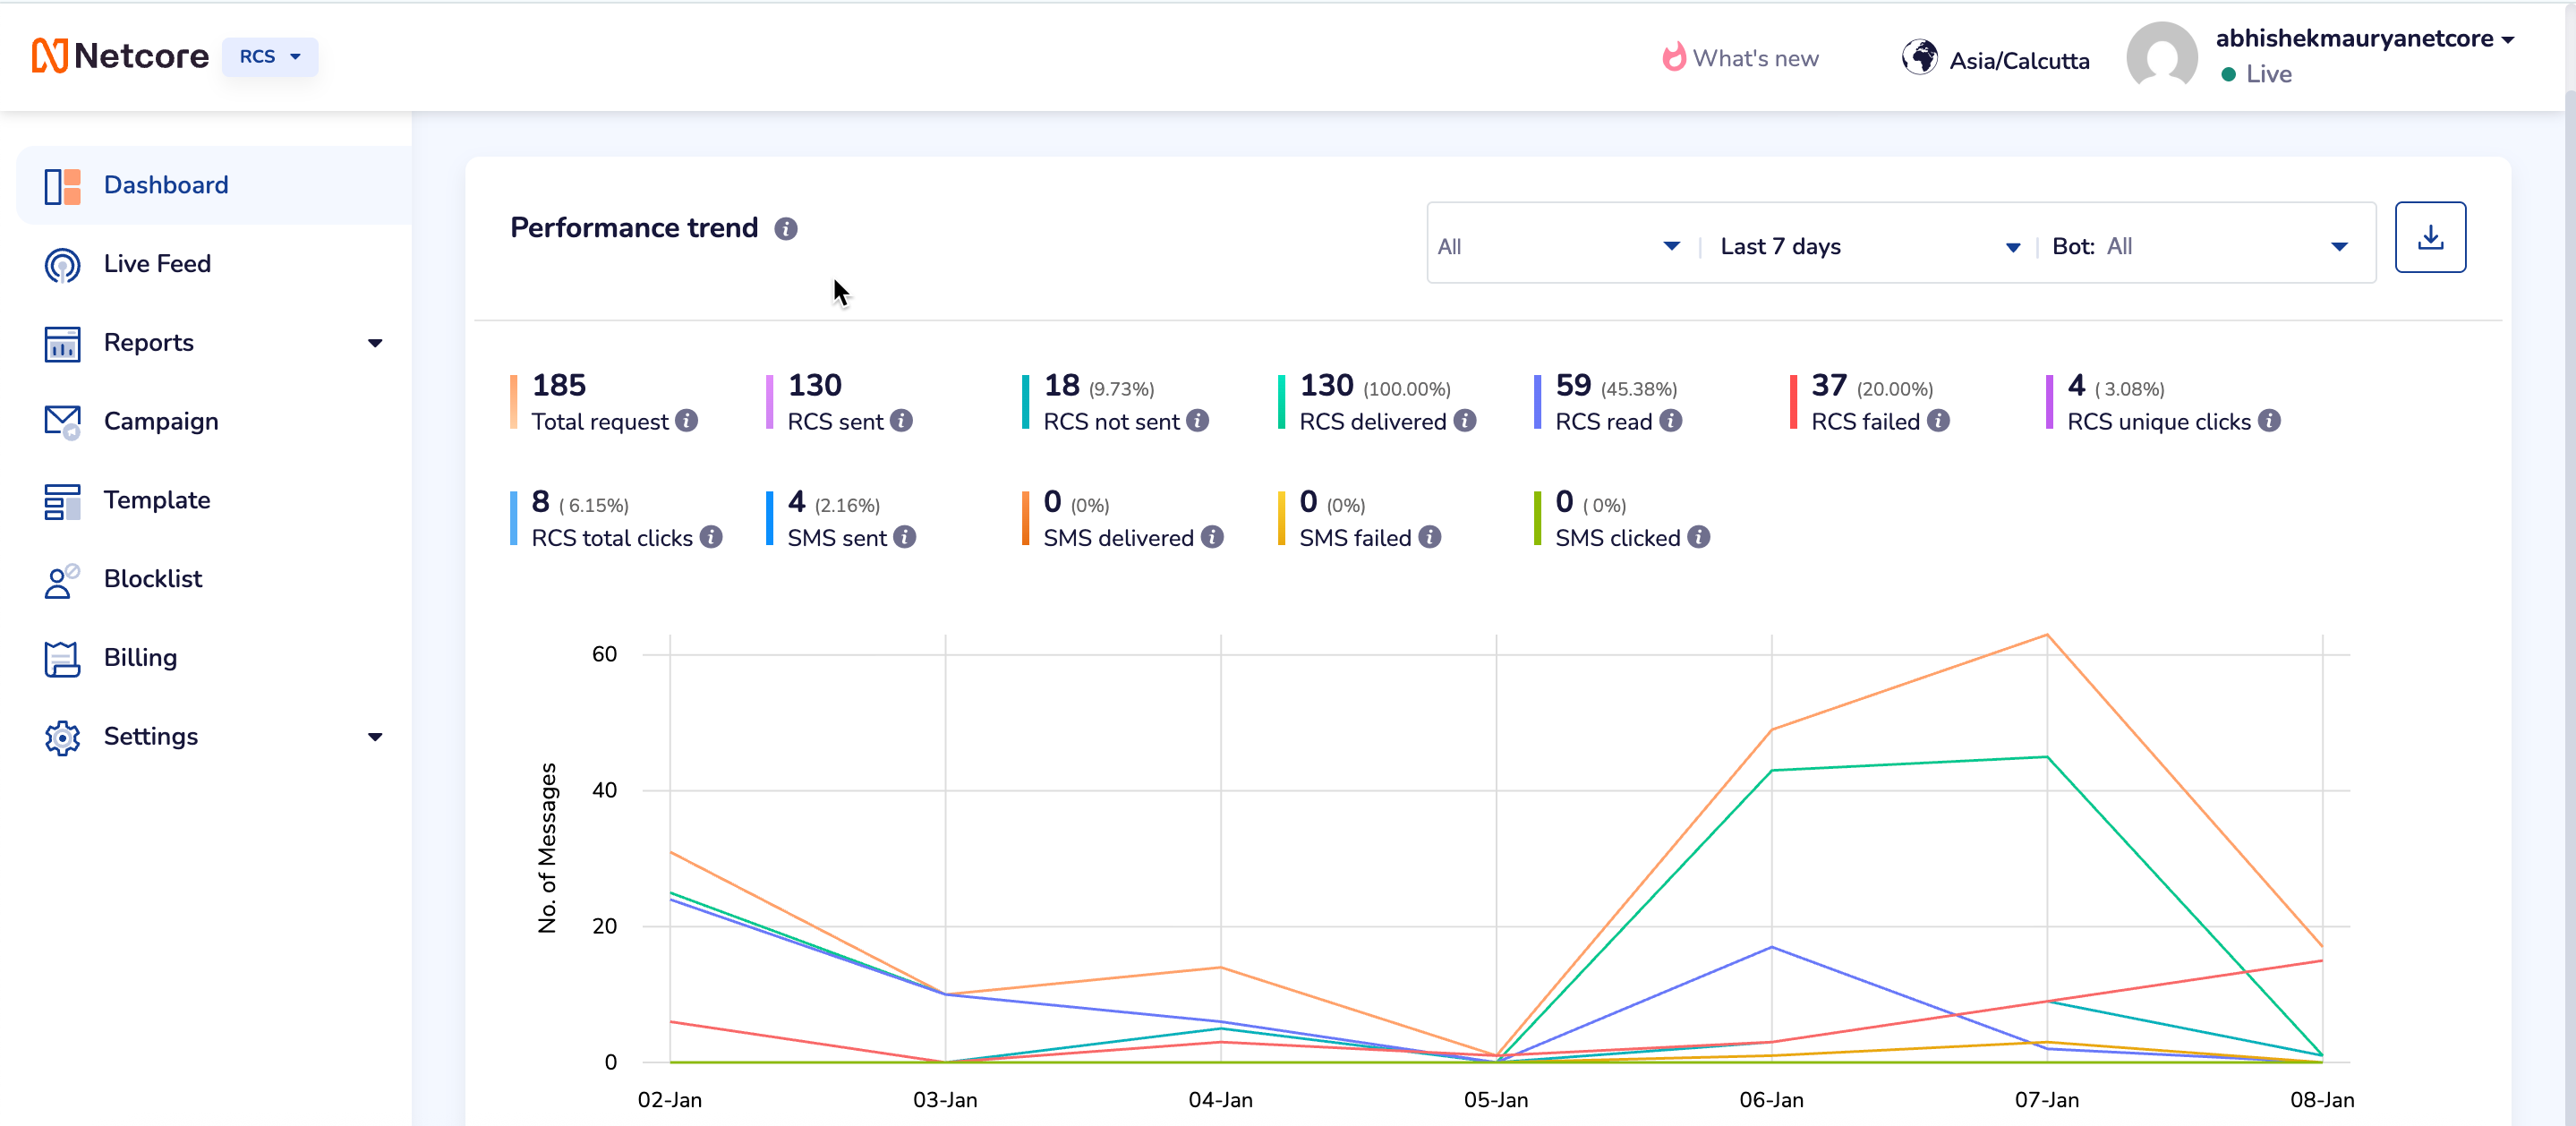
RCS Dashboard view
Filters
- Date Range: Select the preferred date range to analyze your campaigns. You can also select a custom date range that provides metrics to help you determine whether the campaigns are making users take desired actions, like buying a product or signing up for an account. Once the preferred date range is selected, click APPLY .
Available options in the dropdown menu are:
- Last 7 Days
- Last 30 Days
- Last 90 Days
- Custom Range
Bot Selection: Filter data by specific bot or view all bot performance.
Performance Trend
Track key metrics across all incoming requests to monitor system activity and performance. Visual charts show trends in message activity, like Total Requests, Sent, Delivered, and Failed. Use these insights to quickly spot issues, understand user behavior, and improve performance. Refer to the table to learn about the fields available here.
| Metric | Description |
|---|---|
| Total request | Total number of message requests initiated during the selected period. |
| RCS sent | Number of RCS messages successfully sent by the operator. For example, there are 1,000 customers to which a RCS campaign is to be sent. |
| RCS not sent | Number of RCS messages that were not sent. |
| RCS delivered | Number of RCS messages successfully delivered to recipients. |
| RCS read | Number of RCS messages opened/read by recipients. |
| RCS failed | Number of RCS messages that failed to deliver by the operator. |
| RCS total clicks | Total number of clicks on links within RCS messages. |
| RCS unique clicks | Number of unique recipients who clicked links in RCS messages. |
| SMS sent | Number of SMS messages sent as part of fallback. |
| SMS delivered | Number of SMS messages delivered successfully. |
| SMS failed | Number of SMS messages that failed to deliver. |
| SMS clicked | Number of recipients who clicked links in SMS messages. |
Performance Trend Graph
The lower section displays a line graph showing message trends over time:
X-axis: Date/time (based on selected range).
Y-axis: Number of messages.
Note
Colored lines represent different message events (RCS sent, delivered, failed, SMS clicks, etc.).